
AI-generated illustration created to represent the article’s subject. It does not depict an actual EPW course, trainer, participant, client, event or venue.
In corporate finance, AOP stands for annual operating plan: a plan for one financial year that connects revenue, costs, profit and cash expectations with the activities and resources needed to deliver them. Finance teams and department managers use an AOP to agree targets, allocate resources, assign responsibilities and compare actual performance with the approved plan.
In plain English, an AOP answers four questions: What will we deliver this year? What will it cost? Can we fund it? Who is responsible? Understanding those connections helps a budget owner challenge an unrealistic target or explain why results have moved away from expectations.
Why do businesses use an annual operating plan?
An AOP turns strategic ambitions into decisions that departments can act on. A goal such as increasing sales becomes a discussion about customer demand, delivery capacity, recruitment, spending and cash collection.
According to Anaplan’s explanation of annual operating planning, departmental leaders develop the AOP across the organisation, linking operational and financial objectives. Finance helps reconcile those commitments into a consistent business view.
Consider a manager proposing 20 additional projects. The useful question is whether people, equipment and working capital can support them. Approving the revenue target without funding delivery creates a gap that a well-prepared AOP should expose.
What does an AOP include?
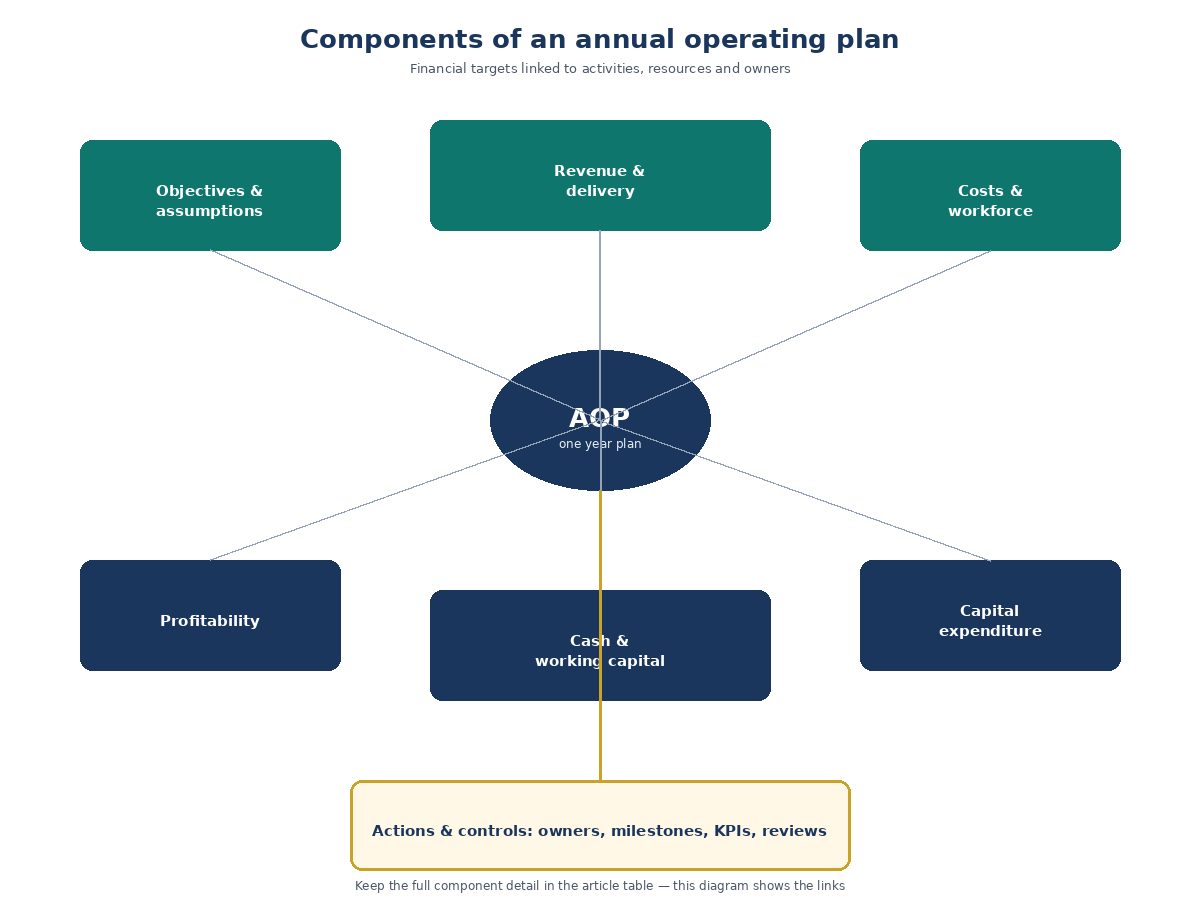
A useful annual operating plan combines financial schedules with the assumptions and actions behind them. The following is a practical planning checklist; the level of detail should fit the business.
| Component | What to include | Question to resolve |
|---|---|---|
| Objectives and assumptions | Priorities, demand, prices, inflation and relevant exchange rates | What needs to be true for the plan to work? |
| Revenue and delivery | Sales volumes, prices, product mix and operational capacity | Can the organisation deliver the sales it expects? |
| Costs and workforce | Direct costs, overheads, staffing levels and recruitment dates | Which costs change with activity, and when? |
| Profitability | Gross margin and operating profit; financing and tax where relevant | What return remains after the planned costs? |
| Cash and working capital | Customer receipts, supplier payments and inventory requirements | Will cash be available when payments fall due? |
| Capital expenditure | Asset purchases, payment timing and depreciation assumptions | Which investments need funding? |
| Actions and controls | Owners, milestones, key performance indicators and review dates | Who acts when performance departs from plan? |
Check that these schedules agree. For example, a planned recruitment date should affect both delivery capacity and payroll. Relevant movements in receivables, inventory, assets and borrowing should also reconcile with the planned balance sheet.
How does annual operating planning work?
The process connects management’s priorities with department-level evidence, then establishes an approved baseline for the year. A practical sequence is:
- Agree the planning basis. Define the financial year, currency, priorities and shared assumptions. Separate recurring activity from one-off events.
- Build from business drivers. Estimate revenue from volumes and prices, and costs from staffing, capacity and purchasing requirements.
- Reconcile departments. Confirm that sales expectations match operational capacity and that spending appears in the right months.
- Test affordability. Examine profit and cash under the base case and plausible downside assumptions, such as slower collections.
- Approve and assign ownership. Follow the organisation’s approval process, record the agreed version and name the people responsible for actions.
- Review and respond. Compare actual results with the plan and update expectations when evidence changes.
Financial planning and analysis (FP&A) coordinates the model and challenges assumptions; operational managers need to own the activities behind their numbers. Avoid spreading annual totals evenly across 12 months when contract timing, seasonality or hiring dates suggest otherwise.
For managers developing these skills, EPW’s Finance and Accounting Training Courses cover budgeting, financial analysis and related decision-making techniques.
AOP example: connecting revenue, profit and cash
Hypothetical teaching example: a services business plans to complete 120 projects over one financial year at an average recognised revenue of £10,000 per project. These are illustrative assumptions, not EPW’s financial results or an industry benchmark.
The annual profit plan
| Item | Planning basis | Annual amount |
|---|---|---|
| Revenue | 120 projects × £10,000 | £1,200,000 |
| Direct delivery costs | 120 projects × £4,000 | £480,000 |
| Gross profit | Revenue less direct delivery costs | £720,000 |
| Payroll | Support and management staff, separate from direct delivery costs | £360,000 |
| Other operating costs | Rent, systems, administration and similar costs | £180,000 |
| Depreciation | Annual expense under the assumed asset schedule | £20,000 |
| Operating profit | £720,000 − £360,000 − £180,000 − £20,000 | £160,000 |
The planned operating margin is £160,000 ÷ £1,200,000 × 100 = 13.3%, rounded. Operating profit here is before financing costs and tax; it is not net profit.
The numbers still need operational commitments. The sales owner must substantiate 120 projects, the delivery manager must demonstrate capacity, and the finance team must check when customer payments arrive. Those commitments make the financial projection an operating plan.
Why £160,000 profit does not mean £160,000 extra cash
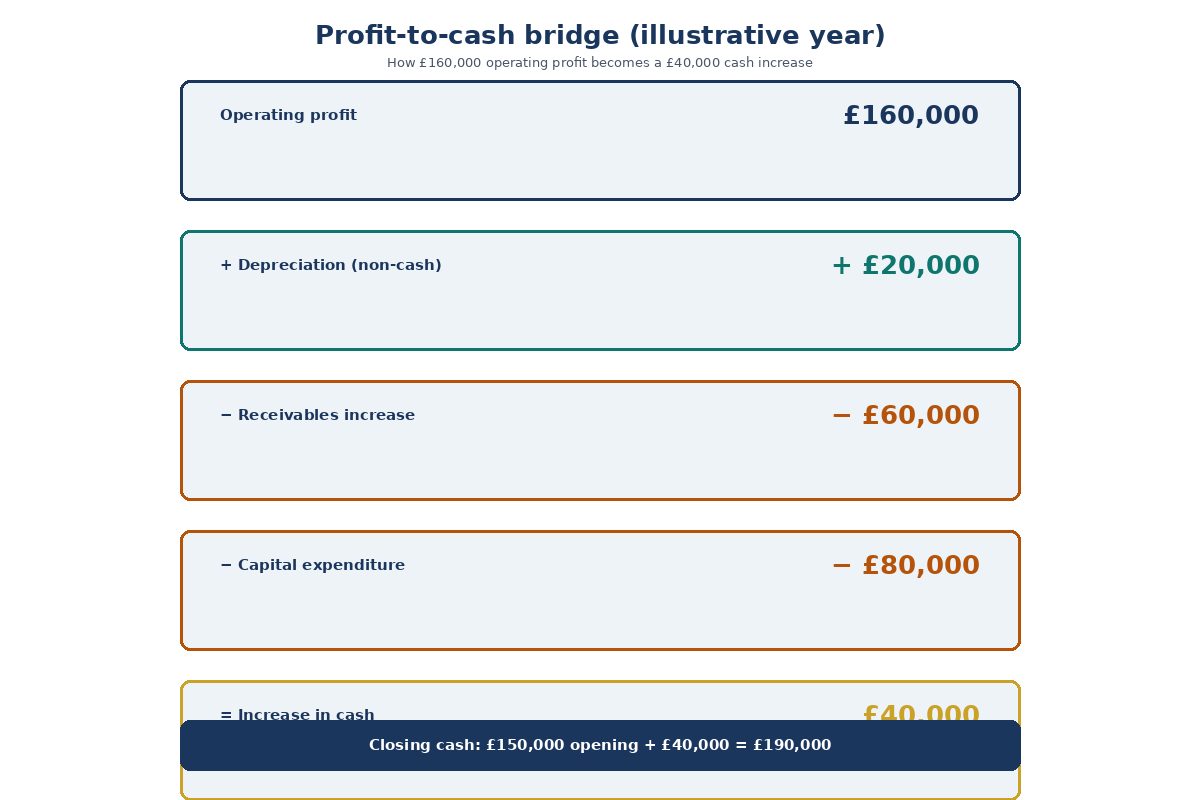
Assume opening cash of £150,000, no opening customer receivables or supplier payables, and £60,000 of this year’s sales still uncollected at year end. All operating costs except depreciation are paid during the year. The business also pays £80,000 for capital assets.
This simplified example excludes taxes, financing, dividends and other working-capital movements. Customer cash receipts are £1,140,000, and cash operating payments total £1,020,000.
| Calculation | Amount |
|---|---|
| Operating profit | £160,000 |
| Add back non-cash depreciation | + £20,000 |
| Deduct increase in uncollected customer receivables | − £60,000 |
| Deduct cash paid for capital assets | − £80,000 |
| Increase in cash | £40,000 |
| Closing cash: £150,000 opening cash + £40,000 | £190,000 |
According to ACCA’s guidance on cash budgets, cash planning accounts for when receipts and payments occur; depreciation itself is not a cash payment. Here, the asset purchase affects cash, while depreciation affects profit.
A positive year-end balance still does not prove that every month is adequately funded. Paying for equipment early and collecting customer invoices late could create an interim shortfall. For more on that timing issue, read EPW’s guide to cash flow management for small businesses.
AOP vs budget vs forecast: what is the difference?
An AOP sets the annual operating commitment; a budget quantifies agreed financial targets and allocations; a forecast estimates the likely outcome using current information. The terms overlap. Farseer’s AOP explanation notes that organisations use labels such as budget, commitment, target and plan differently.
| Term | Main question | Typical use |
|---|---|---|
| Annual operating plan | What have we agreed to deliver, and how? | Connect targets with operating assumptions, actions, resources and owners. |
| Budget | What financial targets and resources have been agreed? | Set quantified expectations for revenue, costs, cash and investment. |
| Forecast | What now looks likely to happen? | Refresh expected results as actual performance and assumptions change. |
According to Oracle’s financial-planning guidance, budgets establish financial expectations and benchmarks, while forecasts are revisited using performance and new information. A budget is therefore broader than a spending limit.
In the example, the AOP might retain its £1.2 million revenue target while the latest forecast falls to £1.1 million. Keeping both visible shows the original commitment and the emerging gap. If management formally revises the plan, retain the original version and document the approval.
A rolling forecast extends the planning horizon as time passes, for example by adding a new month to maintain a 12-month forward view. Updating estimates only to the same financial year end does not, by itself, make a forecast rolling.
How should managers interpret performance against AOP?
Compare results with the agreed plan, then investigate the business drivers behind the difference. Lower spending can reflect reduced activity rather than better cost control.
Suppose a separate, simplified plan allows £40,000 of variable costs for 1,000 units: £40 per unit. Actual delivery is 900 units, with variable costs of £37,800. Spending appears £2,200 below the original plan.
However, the expected cost for 900 units is 900 × £40 = £36,000. Actual costs are therefore £1,800 higher than expected for the activity delivered. This is an adverse spending variance, despite spending less than the original total.
ACCA’s explanation of flexible budgeting supports adjusting the comparison for actual activity. The management response is to investigate the higher unit cost and the delivery shortfall separately, assign actions and reflect the evidence in the latest forecast.
Other questions about AOP in finance
Does an AOP have one calculation formula?
No. An AOP is a connected plan, not a single financial ratio. Its calculations depend on the business: a project company might use projects × average revenue, while a subscription business needs customer numbers, prices, renewals and churn assumptions.
Can a small business prepare an AOP in a spreadsheet?
Yes. A spreadsheet can hold assumptions, monthly revenue and cost schedules, cash movements and action owners. Protect formulas, identify the approved version and reconcile totals. The important test is whether the model explains decisions and can be maintained reliably.
Develop the skills to build and challenge an AOP
A useful AOP lets you trace a target back to operational evidence, identify its cash consequences and name the person responsible for delivery. When reviewing a plan, ask: Which assumption drives this number, when does it affect cash, and what action follows if it changes?
To practise the budgeting and forecasting skills behind annual operating planning, explore EPW’s Budgeting and Forecasting Techniques for Managers course. Review the course outline and available dates and locations to assess its relevance to your role.
Sources and References
Sources checked on 14 September 2026. Calculations and scenarios in this article are original illustrative teaching examples.
- Anaplan. Tomorrow’s annual operating plan. Undated webpage.
- ACCA. Cash budgets. Undated technical article.
- Farseer. How to Build an Annual Operating Plan (AOP): A Step-by-Step Guide for FP&A Teams. 28 August 2026.
- Oracle. What is financial planning? Undated webpage.
- ACCA. All about budgeting – part 1. Undated technical article.